Climate Station Zebra™ 50,000 Global Station Goal

Be a Part of and Benefit from an Independent Global Network for Collecting Weather and Climate Data
Providing an Alternative Source of Independent, Accurate, Global Climate Science Data
Governments Control the Temperature Data but We Also Need an Independent Source.
The question we all have to ask is if the governments are misrepresenting data, for which we have evidence, and corrupt at the highest levels that most of us can do little about, then what is going to happen to society as a result?
The forcing of inadequate renewable energy and dangerous electric vehicles is justified by corrupted science, which is ultimately supported by altered data. We cannot necessarily change the corruption, but we can undermine their policy support with widespread availability of legitimate and verifiable data sources. Yes, it will take time to develop a robust and extensive climate database from real-time measurements across a global privately-owned source of climate data. But not all data is altered, much of the existing data sources can be salvaged in their raw form and incorporated into new, transparently validated sources to provide an historical backdrop for technologically-improved, scientific data sources.
The effect of bad policy is to reduce fuel availability, raising energy costs across economies, and limit the purchase of types of fuel-consuming vehicles and generators. This latter undermines freedom of travel and can put populations at risk of black-outs and lack of emergency power. Policy can be changed with widespread availability of better knowledge and data, and government officials will find it difficult to persuade people who see they are lying.
Today we do not have a “global temperature”. The correct way to get a temperature of the planet Earth, or any planet, is to take a real-time snap-shot of the energy being emitted around the planet at a given time. We need satellites with special sensors for that, which we do not have today.
Then we use the Stefan-Boltzmann law and a clever but accurate satellite-derived calculation of emissivity ɛ to determine the Temperature from the equation:
A Professional, Scientific Weather & Climate Station
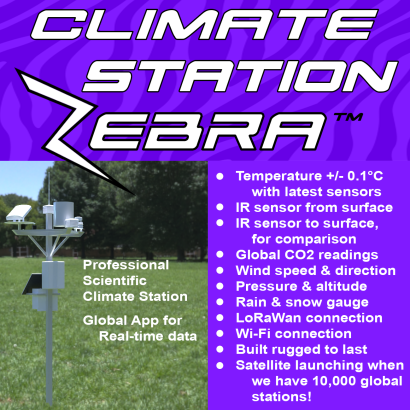
Our goal is to bring the Climate Station Zebra™, shown on the right/below to 50,000 owners around the world, who will provide objective, distributed, verifiable, secure and privacy-protected data to the climatescience.network for real-time, accurate climate data established on a scientific standard.
You will also benefit with a mobile/PC app from which
you can instantly view the weather at your home or office site from anywhere on Earth, and also see a summary of the weather as it is and how it compares to the past climate everywhere else on Earth where there is a similar station.
Installation requires an area in the grass at least 10m from any structure, without asphalt or concrete. A sleeve the post can be locked into can be placed into the ground in a ~6”/15cm hole dug 12″/30cm deep and fixed with <1 bag of pre-mixed cement.
Globally-connected Through a Windows 11 PC
The U.S. Climate Reference Network (USCRN) has had up to 1,200 climate stations measuring the weather since the latter 19th century, but we need a better standard more broadly distributed and scientifically collected and verified to rely upon for industrial, scientific and commercial use.
In time, the Climate Station Zebra™ will provide a readily-available, real-time, live snapshot of the global climate!
The Most Advanced Scientific Features and Benefits
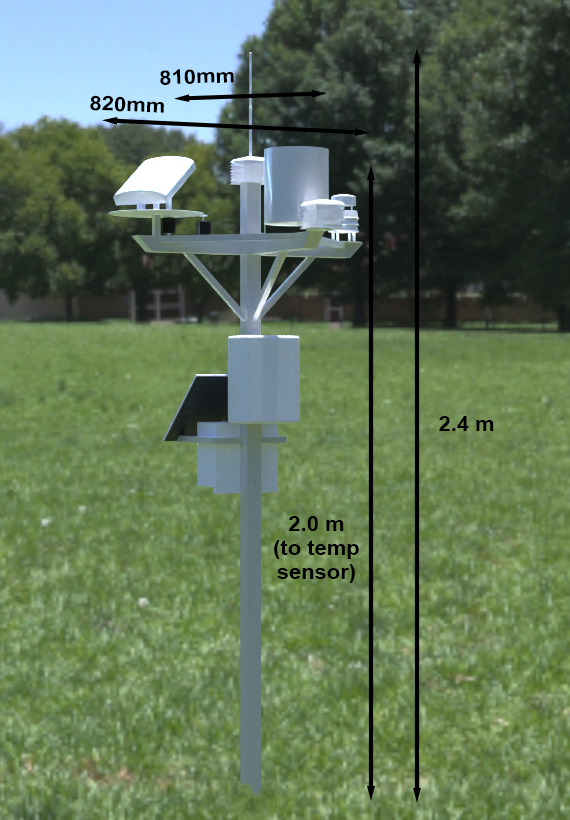
- Includes a 12th-Gen Intel 2.4Ghz, Windows 11 Computer, with 8GB 512GB DDR4, including Wi-Fi and LoRaWan for long-distance wireless communications, and automatic software upgrades
- Already incorporates LoRaWan antenna and link for scientific satellite communications
- Industrial Grade CO2 Gas Sensor
- Easy to assemble and install
- Made from aluminum for a long-life, powder-coated white to minimize heat build-up
- Temperature sensor is a standard 2m above the ground surface, unit has one side facing North
- Custom-made by our manufacturing partner to the higher scientific standards that we need for a trustworthy, global climate-science network
- Includes auto-tracking solar panel and deep-cycle battery to optimize energy availability, with digital and LED battery charge indicator
- The electronics are rated IP67 thus weather-proof, and engineered for 70 m/s (157mph) wind loading, with engineered shielding for all sensors to limit reflections and radiation from other sources
- Two sensors for the full Earth Infrared spectrum, from 0.7μm to 120μm: the Outgoing IR radiation will be compared to the Incoming IR radiation. We are seeking to confirm what we expect to be the case: that outgoing IR is always greater than incoming, thus the energy returning from GHGs cannot warm the surface of Earth. Of course if it is not the case, then we will learn something about the circumstances when it is not
- Rain and Snow gauges, self-draining and heated when below freezing.
Importantly, the primary benefit of the Climate Station Zebra™ is that business people, scientists and engineers globally will have a source of data that they can trust and have easily and quickly available without additional cost, for their home base as well as other locations on the network.
You’ll have your own email address at climatescience.network, a global communications hub for all members, and the channel through which your climate station will connect to the global network of data and to which a future satellite will communicate to and from your station.
Climate Station CO2 Sensor
Did you know that the primary site for global CO2 measurement is next to a volcano in Hawaii that emits lots of CO2? The site is also in the middle of the Pacific Ocean, the world’s largest source of CO2. Oceans hold about 50-times the amount of CO2 as the atmosphere, so surrounding a CO2 measurement site with ocean water is a bit, well, concerning.
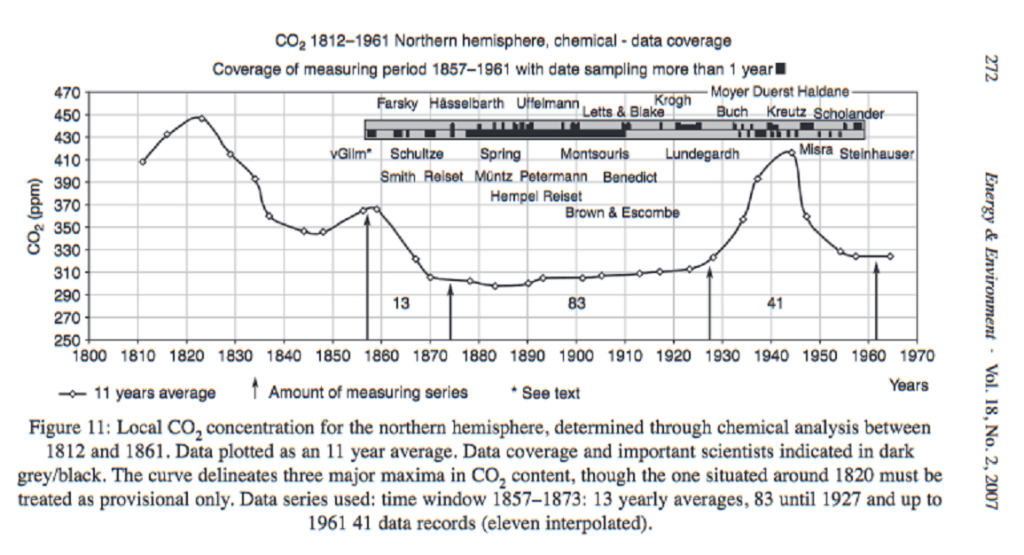
So we have a volcano and oceans influencing the global standard for CO2 measurements. Seems a bit odd, to be frank. Mauna Loa may claim the longest record of direct measurements of CO2, but are they the best site for them? Scientists have actually measured atmospheric CO2 since the 19th century, as on the below right, when CO2 readings exceeded today’s levels.
With the Climate Station Zebra™ feeding the climatescience.network with CO2 measurements taken precisely, with the same standard sensor from all over the globe, with additional information like altitude, temperature and humidity, we should learn much more about the atmosphere’s average CO2 content and what that implies.
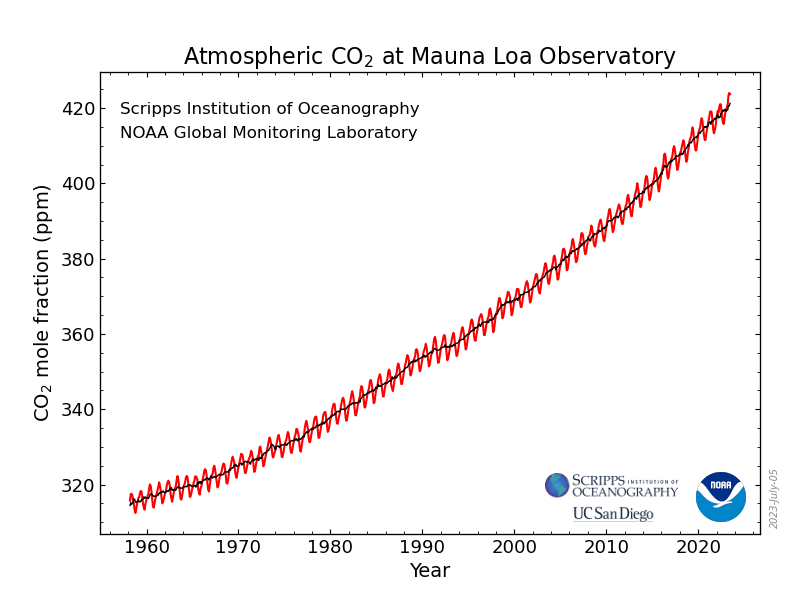
Above are measurements from Hawaii, while below are those by competent scientists from as early as 1812.
Climate Science Satellite Global Temperature Sensor Grid
Every day since January, 2023, the Climate Science Journal has posted on its twitter site the global anomalies–the difference between a particular 22km x 22km location and the average for that same spot, at the same time, for 1980-2022.
What we see is that the warm and cool regions just about equal one another, showing thermodynamic equilibrium. We need to make this more precise, with our own temperature data set, and show exactly the variance from our satellite in space.
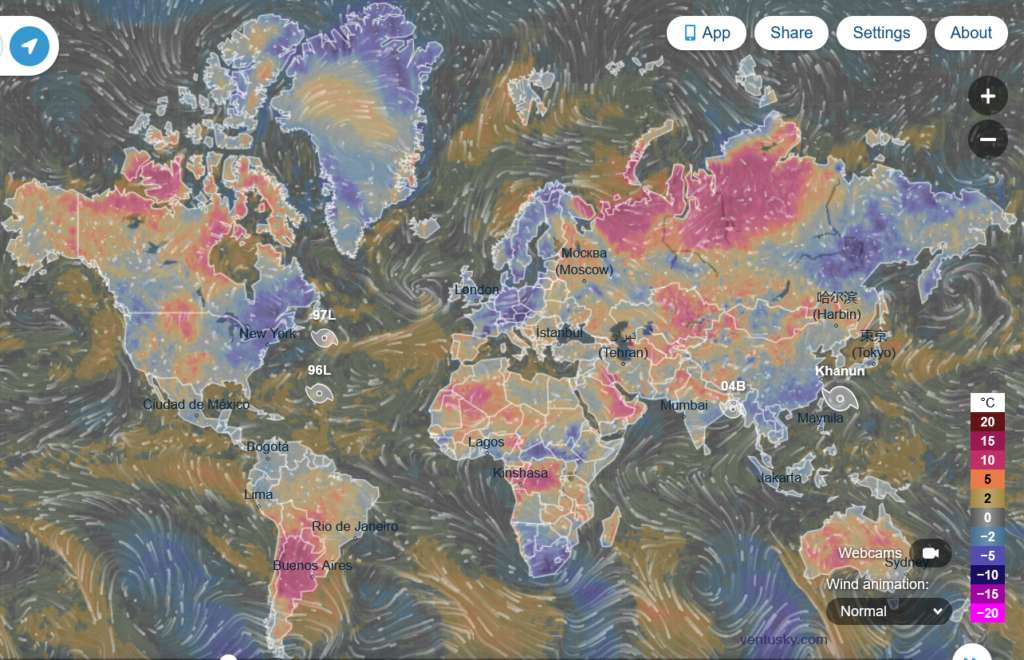
The Climate Station Zebra™ grid of global stations will be critical in correlating satellite temperatures with Earth temperatures at 2m above the surface.
Maintaining these standards for a global network will allow us to make many kinds of correlations and test them against accurate evidence. We will use the latest AI technology to help us with this task.
Climate Science Satellite Global Solar Irradiation Monitor
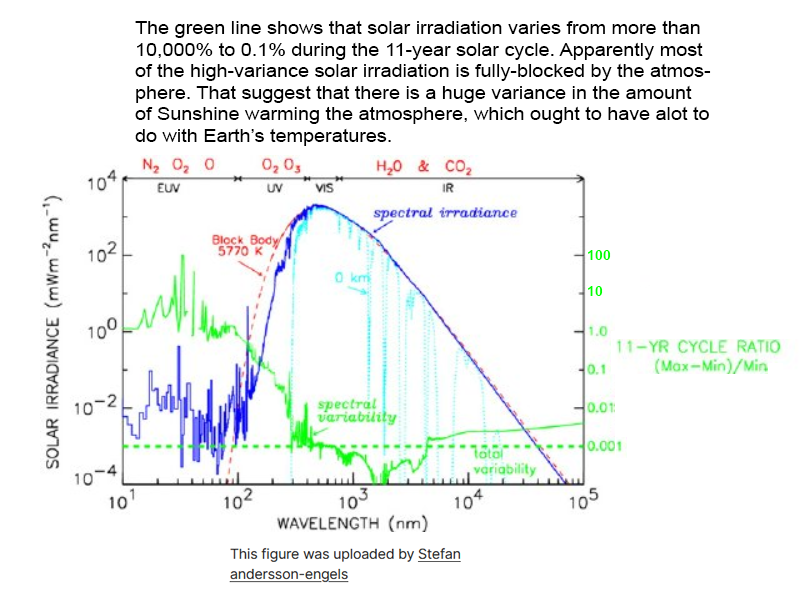
In order to determine if the Sun changes its value of radiation, and thus affects Earth’s temperature, we have to have sensors for the full solar spectrum pointed at the Sun each day, over its 11-year cycle (the lifetime of our satellites is expected to be ~15 years).
NASA and others claim we have a “solar constant”, that we can assume the solar radiation does not vary much. But is that so? The chart on the right shows variation of solar energy between 0.1% and 10,000% over a period of 11-years. What? If this is correct, then it is of huge importance. We have to check everything.
Climate Science Satellite Global Solar Irradiation Compared to Surface Radiation
By comparing the amount of solar radiation we receive in space with that received on the surface through the Climate Station Zebra™ network, we will be able to see how much solar radiation is absorbed by the atmosphere by the major gases of nitrogen and oxygen that make up 99%.
Contrary to consensus, both nitrogen and oxygen absorb and radiate in the Infrared spectrum, but not by molecular vibrational or rotational changes, but by electronic level changes.
Given the solar spectrum, we can see how much, and compare that to the amount leaving (using day and night monitoring to help distinguish the difference).
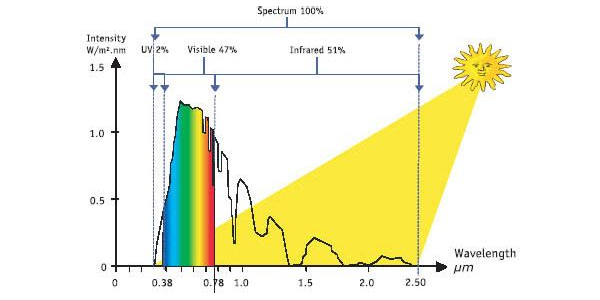
Solar radiation is approximately half in the Infrared region of the spectrum. Nitrogen, shown below, absorbs IR from the 1-8μm range, as does oxygen.

It is imperative that we have an independent, verifiable source of global climate data that is not controlled by the political hegemony established by Marxists in the academic world. Because scientists in the physical sciences are not (generally) experts in the humanities, they too often accept what they are taught in the fields of politics, economics, psychology, etc., rather than stick their necks out to challenge the consensus.
Rather than challenging group-think when it is wrong or exaggerated, as for the Global Warming extremists, academics of the physical sciences unfortunately more frequently conform rather than fight the status quo so that they or their institutions are able to receive funding from leftist government-sanctioned sources.
About the Project and Founder
The project is led by a technically-qualified business person (LI) with more than 30-years of experience as an entrepreneur. With degrees in aerospace engineering and computer science, he has developed and delivered products and services to dozens of G200 companies and hundreds of other clients. As Editor of the Climate Science Journal for more than 7-years, he knows first hand the challenges facing identifying accurate data and the errors in scientific understanding underlying the still immature field of climate science.
Governments Have Been Altering the Data and Standards: We Need an Honest Alternative
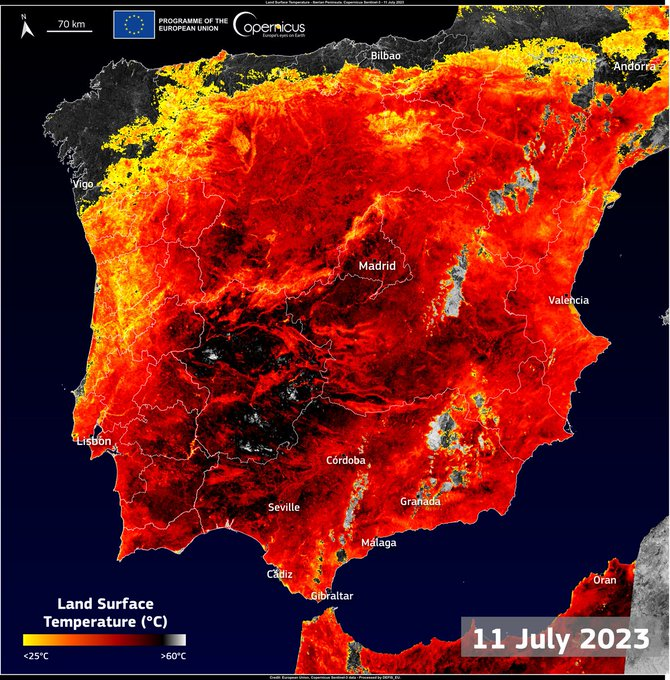
The ESA started using Land Surface Temperatures, not air temperatures at 2m above the surface. They supplied this new temperature standard to the press, without clarifying to the viewers that “the map shows the actual temperature of the land’s surface which is significantly hotter than air temperatures”. And the scary colors?
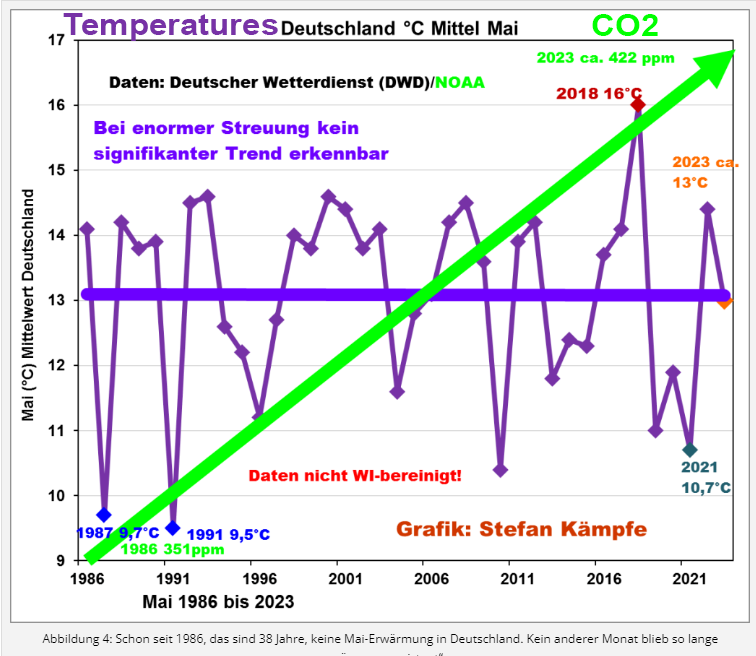
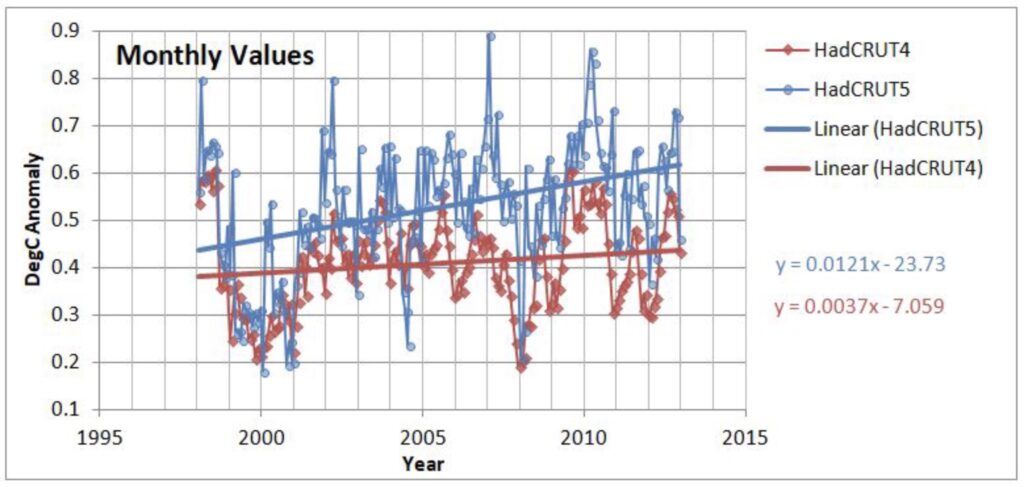
In Germany, above, we see CO2 rises with no corresponding temperature rises. Below, the UK has also altered their data.
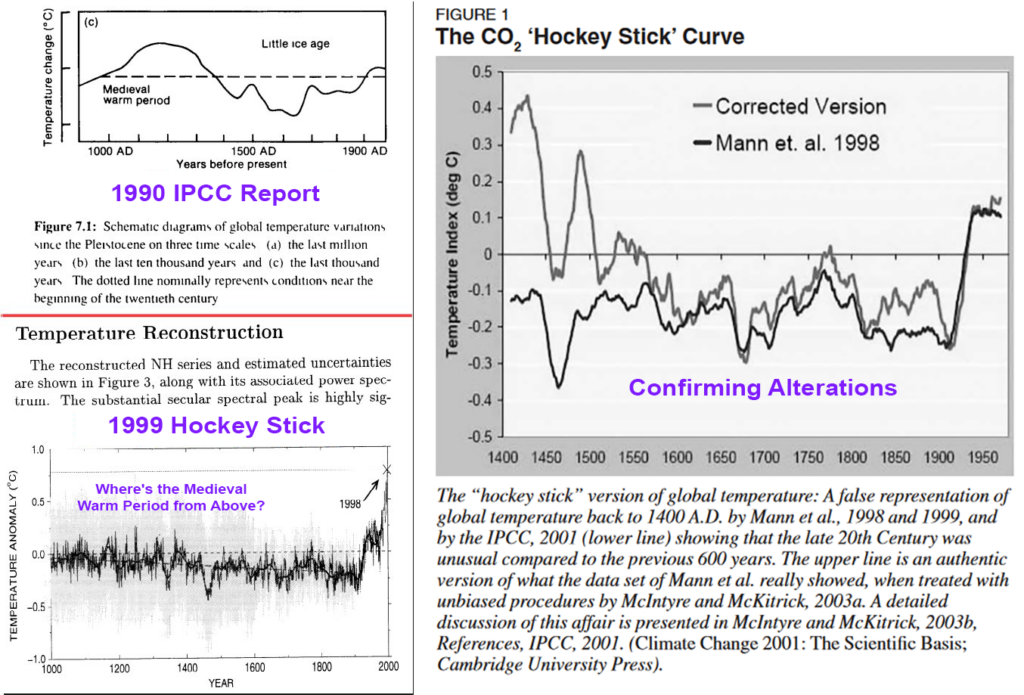
Above, the IPCC changed temperatures to the lower left, with the alterations confirming the changes on its right, and below are NASA’s “time of observation” alterations.
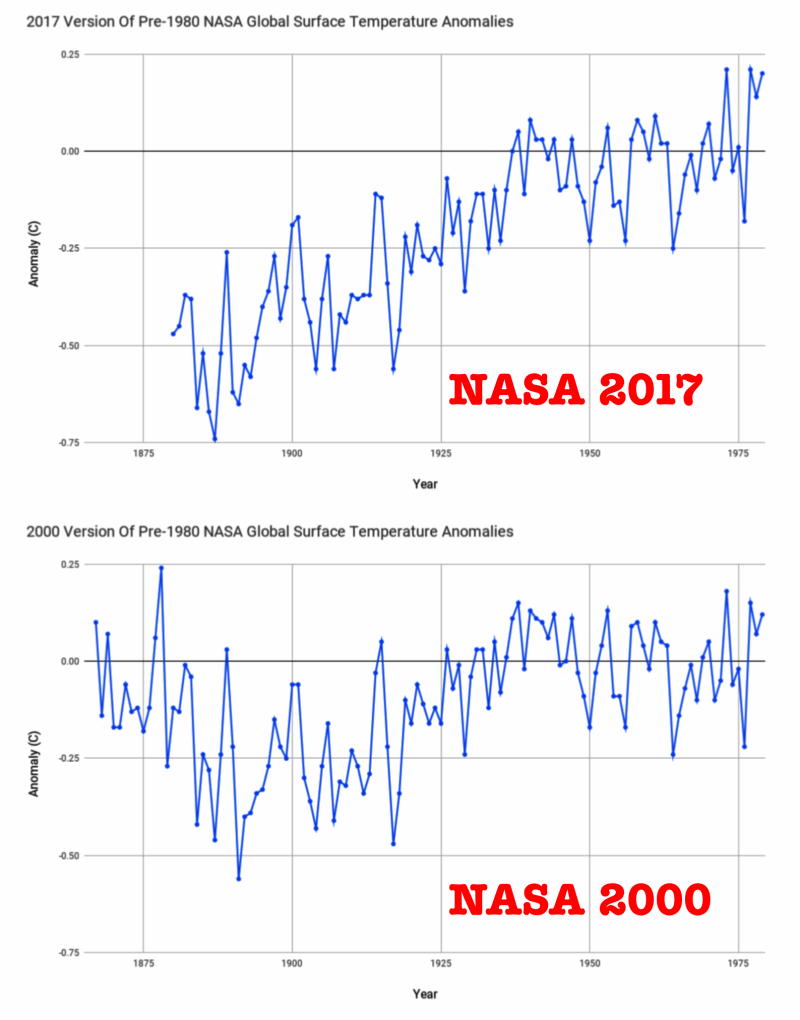
The above examples show that government agencies across the globe have basically altered the standards of measurement and the past records, so that any “record” temperatures have not been actual record temperatures, unless on the short-term. To keep them honest, we need an alternative.
